LOOKPORT / TICKETING & EVENT BUDGETING
Profit Margins: Test 10 P&L Lines for UK Concert Promoters
See how UK concert promoters can model profit per show with 10 P&L inputs, test sell through and costs, and check break even before committing a deposit.
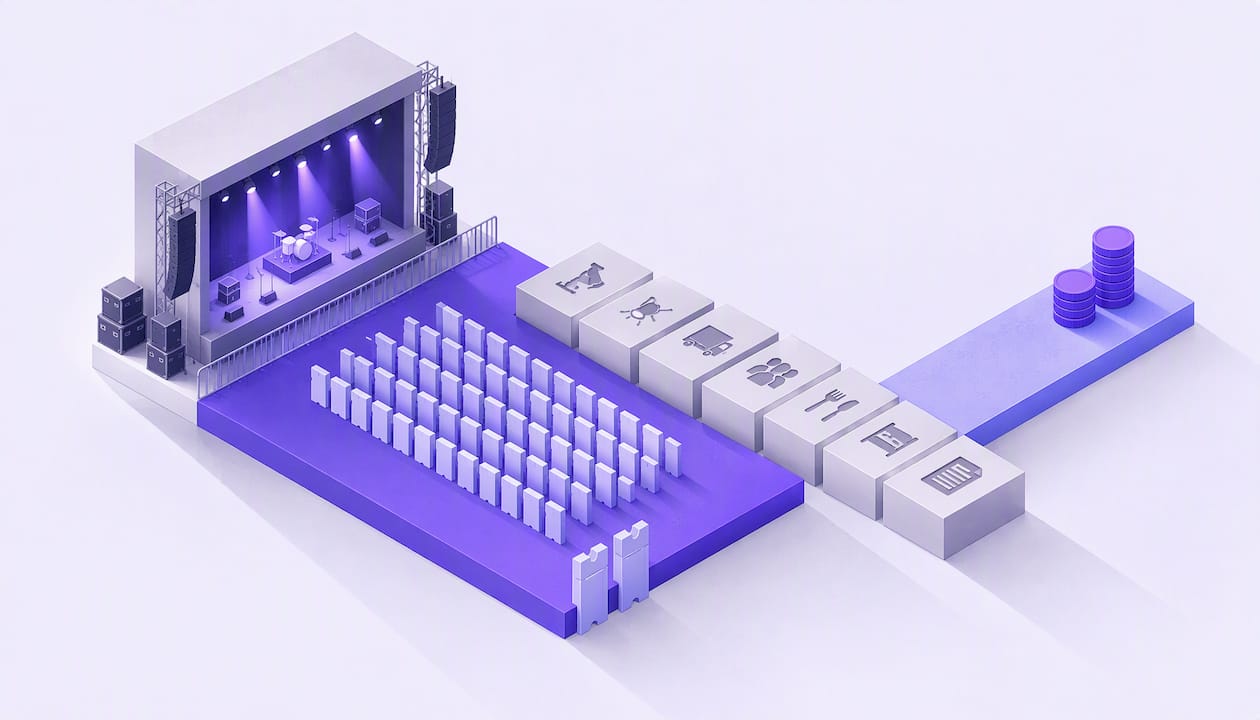
Most promoters can expect a thin net margin on a single show, and a loss when sell-through slips. Where you land inside that band depends on three things: how many seats you fill, how much revenue comes from beyond the ticket, and how tightly you control costs. All figures here are hypothetical. Run your own inputs through a break-even model before you commit a deposit.
TL;DR:
- Artist guarantees and venue hire remain fixed as attendance falls, so model the break even ticket count before committing deposits or accepting deal terms.
- Advance sales reveal demand early and can guide marketing or cost cuts, while relying on day of walk ups leaves the full cost base exposed.
- Sponsorship can add high margin revenue once contracted, but merchandise splits, VIP fulfillment costs, and food sales controlled by venues limit other ancillary income.
- Test lower sell through alongside higher costs, and track break even ticket count, margin per ticket, and cash flow timing before paying deposits.
- Larger shows and tours can spread fixed production costs, but inefficient routing, artist guarantee escalators, or weak demand in one city can erase those gains.
Table of Contents
- How does a show-night P&L work, line by line?
- Which revenue streams actually move your margin?
- Which costs are fixed, variable or creeping up?
- How do margins change with scale and business model?
- What can you change to improve profit per show?
- Which tools help you test your own margin?
- Where we can help you model and protect margins
- FAQ
- Sources
How does a show-night P&L work, line by line?
A show P&L starts with gross potential: capacity multiplied by average ticket price. Ticketing fees, booking charges and VAT reduce that figure to net ticket revenue, which is the number you actually have to spend. From there, the headline outgoing is the artist deal. Guarantees are paid whatever the sell-through, while percentage deals share upside and downside. A common structure is a guarantee against a percentage of net after costs, so the artist is paid whichever is higher. Our concert budget breakdown covers the same lines in more detail.
Here is a hypothetical worked example for a theatre show, with every figure illustrative:
- Gross potential: ticket capacity multiplied by the average ticket price.
- Sell-through: apply an assumed sell-through rate to estimate tickets sold and gross sales.
- Less VAT and fees absorbed: deduct these to estimate net ticket revenue.
- Artist guarantee: enter the assumed guarantee.
- Venue hire: enter the assumed hire cost.
- Production and sound or lighting hire: enter the assumed costs.
- Staffing and security: enter the assumed costs.
- Marketing: enter the assumed spend.
- Box office, insurance and settlement costs: enter the assumed costs.
- Total costs: subtract total costs from net ticket revenue to estimate the net profit and margin.
In this example, the guarantee and venue hire are major costs. Notice how little room there is: a drop in sell-through can leave the same costs producing a loss. Treat the guarantee as your fixed risk line and every other line as a negotiation.
Which revenue streams actually move your margin?
Ticket sales carry the show, but their margin depends on sell-through, price tiers and how much of each ticket you keep after fees. A seat sold at the top tier contributes far more per head than a discounted one, because the cost of delivering both is nearly identical. That is why pricing discipline matters as much as volume.
Secondary income behaves differently:
- Merchandise: usually a split with the artist or venue, so your share is modest and depends on the act’s fan base.
- Sponsorship: high margin once sold, but uncertain until contracted.
- VIP packages: a premium tier with fulfilment costs, so margin per package is lower than the price suggests.
- Food and beverage splits: typically controlled by the venue, so your share is a negotiated percentage.
Timing matters too. Advance sales give you early cash and a read on demand, which lets you adjust marketing or cut costs. Day-of sales are riskier: you carry the full cost base while hoping the door fills. A show that depends on late walk-ups has a fragile margin.
Our AI ticketing analytics guide explains how to read advance-sales pacing against a forecast.
Which costs are fixed, variable or creeping up?
Separating cost types shows you which lines you can still change after the date is booked.
- Fixed costs: venue hire and deposits, artist guarantees and core production kit. They stay the same whether you sell 400 tickets or 1,000.
- Variable costs: per-head security and stewarding, per-ticket fees and some catering. These rise and fall with attendance.
- Semi-variable costs: marketing spend and, on a tour, travel and routing. You can scale them, but cutting too hard suppresses sales, so their elasticity needs testing rather than guessing.
Seasonality also shifts the picture. Peak-date venues charge more, and marketing costs rise when competing events crowd the same weeks.
Then there are costs that grow underneath you. Inflation lifts crew, transport and equipment hire. Insurance premiums and, for international acts, visa and work-permit costs add lines that did not exist a few years ago. Because fixed costs form a large share of a show’s budget, even small percentage increases erode a margin that was already thin.
The practical response is sensitivity modelling. Increase every cost line in your downside scenarios and see where break-even moves. Our tour budget template gives you a structure for doing this across multiple dates, including routing assumptions.

How do margins change with scale and business model?
Margins usually improve as capacity grows, because fixed costs are spread across more tickets. A guarantee or production package that swallows a club budget becomes a smaller share of an arena budget. Larger shows also gain sponsorship leverage and stronger negotiating power with suppliers and venues.
Three hypothetical scenarios show the pattern:
- Small club: margins can be thin or negative. Fixed costs may be low in absolute terms but significant per ticket, so weak sell-through can wipe out profit.
- Mid-size theatre: margins depend on sell-through, costs and ancillary income.
- Multi-date tour: margins can improve as production costs are pooled across dates and marketing is shared, but only if routing is efficient and demand is consistent across cities.
Scale is not a guarantee, though. Larger shows bring complexity: routing and transport costs, artist escalation clauses that raise the guarantee as sales climb, and higher insurance exposure. A bigger room with weak sell-through loses more money in absolute terms.
The wider market context matters too. US regulators have raised concerns about concentration in live-music ticketing and promotion, which shapes how independent promoters negotiate and compete. In the UK, proposals for an arena ticket levy to support grassroots music show how closely venue economics are being watched.
What can you change to improve profit per show?
Start with the levers you control before the on-sale date, then test them one at a time.
- Pricing: use tiered pricing and VIP products, and set firm limits on discounts and comps.
- Demand: run segmented pre-sales for fan clubs and mailing lists, target paid media at the audiences most likely to buy, and pace announcements to keep advance sales moving.
- Ancillary income: package sponsorship early, place merchandise where footfall is highest, and negotiate your share of food and beverage sales.
- Costs: negotiate riders line by line, stage staffing to match the arrival curve, pool production across tour dates and hold a contingency for overruns.
The first experiments should be the cheapest to run: adjust tier pricing, then pre-sale timing, then marketing mix. Track sell-through against forecast, average revenue per fan and margin per ticket, not just total revenue. Our guide to AI ticket forecasts for UK promoters shows how to test budget cases before deposits are paid.
Which tools help you test your own margin?
A usable model needs a short list of inputs:
- Capacity and ticket-price bands
- Artist guarantee or deal terms
- Production, venue and staffing costs
- Marketing spend
- Per-head variable costs
- Ticketing commission and VAT
From those inputs, read three outputs: the break-even ticket count, the margin per ticket, and how both shift when costs or demand move. Cash flow timing matters as well, since deposits and guarantees are often due before ticket money arrives.
We built our concert profit and tour budget calculator so you can model costs, ticket prices, revenue and break-even for a single show or a tour. Our ticketing fee calculator estimates fees for your own scenarios. Label every worked example as hypothetical, and test the downside as hard as the upside: lower sell-through and higher costs together are the case that actually costs promoters money.
Where we can help you model and protect margins
We charge 6% commission on ticket sales, with no other Lookport charges, and organisers receive proceeds directly into their own Stripe account. Availability follows Stripe-supported countries.
- Run your own scenario in our tour break-even calculator.
- Check fees against your price bands with the ticketing fee tool.
- See how our ticketing works for your next on-sale.
FAQ
How much profit does a concert promoter make per show?
It varies widely with sell-through, deal structure and costs. Many shows end near break-even, while a healthy show’s margin depends on these factors. Model your own inputs, because a small drop in sales can turn a profit into a loss.
Do music promoters get paid?
Yes, but promoters are paid from what remains after the artist, venue and production are covered. Their earnings come from show profit, and sometimes from fees or retained ancillary income. That means promoters carry the risk if a show underperforms.
What costs eat most of a promoter’s margin?
The artist guarantee and venue hire are usually the largest lines. Production, staffing and marketing follow. Because the guarantee is fixed, it is the line that most often decides whether a show breaks even.
How do ticketing fees affect promoter profit?
Fees and VAT reduce gross ticket sales to net revenue, so they directly cut the amount available to cover costs. Modelling the fee on each price band shows the true margin per ticket. Our ticketing fees guide explains how the 6% commission fits into a P&L.
Sources
Recommended
Ticketing & event budgeting
 2026-10-22
Ticketing Analytics for UK Promoters: What to Track and Why
Ticketing analytics for UK concert promoters: the metrics that drive decisions, how to set up tracking, and how to tie sales data back to your show budget.
 2026-10-21
Concert Break-Even Calculator: How Many Tickets You Must Sell
Work out how many tickets a UK concert needs to break even. Costs, PRS, ticket commission, a worked example and a free calculator for promoters and venues.
 2026-10-19
Ticket Sales Break-Even Analysis for UK Shows
Work out how many tickets you must sell to cover a UK show: VAT, PRS, fees, fixed costs and a worked example, plus a free break-even calculator.
 2026-10-18
Refund Policy for Concerts: What UK Promoters Must Offer
What UK law and industry rules require when a concert is cancelled, moved or the buyer changes their mind, plus how to write a clear refund policy.
 2026-10-15
Facebook Ads for UK Promoters: Track Ticket Sales Before Spend
UK promoters can set up Meta pixel and Conversions API tracking, choose audiences, estimate ticket costs, and link Facebook ad spend to ticket revenue.
 2026-10-13
AI Audience Analytics: UK Promoters Use the First 72 Hours of Sales
Use the first 72 hours of ticket sales to spot likely return buyers, test consented campaigns, and plan an 8 to 12 week AI analytics rollout for UK promoters.