LOOKPORT / TICKETING & EVENT BUDGETING
AI Ticket Sales Forecasting for UK Concerts: A Practical Guide
How UK promoters can forecast concert ticket sales with AI: the data to gather, a simple workflow, how to check the forecast and how to turn it into a budget.

An AI ticket sales forecast estimates how many tickets a show will sell by a given date, using your past sales, the current sales curve and demand signals. It is a planning tool. It does not replace your judgement or guarantee a result. Used well, it tells you early whether to hold spend, push marketing or reconsider the budget before you commit deposits.
This guide covers the inputs, a workflow you can follow, how to check a forecast and how to turn it into break-even numbers. General AI methods are described as methods. Where we mention Lookport, we describe only what is on lookport.live.
TL;DR
- A forecast is a range of likely final sales, not a single number. Plan the budget on the low case and the middle case.
- Start with your own data: ticket quantity, revenue per ticket, on-sale dates and sales by day for comparable shows.
- Add intent signals before on-sale (presale sign-ups, waitlists, email clicks) and compare the first days of sales with a similar past show.
- Check every forecast against shows you already know the result of, and update it weekly as the date approaches.
- Turn the range into profit and break-even with the Concert Profit & Tour Budget Calculator.
Table of Contents
- What a ticket sales forecast actually predicts
- How AI differs from a spreadsheet forecast
- The data you need, in order of value
- A workflow you can follow
- A worked example (hypothetical)
- How to check whether a forecast is any good
- Limits you should plan around
- Using audience data lawfully in the UK
- From forecast to budget decisions
- Where Lookport fits
- FAQ
- Next step
- Sources
What a ticket sales forecast actually predicts
A ticket sales forecast answers three questions for one show:
- How many tickets will we have sold on the show date?
- How likely is a sell-out, or a particular sales threshold?
- How will that change if we change price, marketing spend or the on-sale date?
Live events differ from retail in one way that shapes every forecast. Capacity is fixed and the deadline is absolute. A ticket unsold at doors has no value afterwards. That is why the forecast matters most in the weeks when you can still change something.
It also explains why a smooth trend line often fails. Demand for live shows is lumpy. It spikes at the announcement, at the general on-sale, after a press moment or when a rival show goes on sale in the same city. A model that only extends a gentle average will miss those moments.
How AI differs from a spreadsheet forecast
Most promoters already forecast in some form. Many use the last edition of an event as the benchmark, and some go on instinct. Both are reasonable starting points and both can be improved.
The usual spreadsheet method takes a comparable show, notes the share of final sales reached at a given point, and scales it. It is transparent and quick. Its weakness is that you choose one comparison, and you rarely have time to test several.
Machine-learning methods add three things:
- More comparisons at once. A model can weigh many past shows by venue size, genre, day of week, price and lead time.
- More signals. It can combine sales pace with search interest, sign-ups and campaign activity.
- Ranges, not points. Good models give a spread of outcomes with a likelihood attached.
The trade-off is that a model is only as good as the history it learns from. If you have run five shows, a careful spreadsheet with three sensible comparisons is often more honest than a model that pretends to be precise. AI earns its place when you have many shows, many on-sale days of data and a regular need to re-forecast.
The data you need, in order of value
1. Your own sales history
This is the base. UK guidance on ticketing data from consultants Baker Richards lists ticket quantity, gross ticket revenue and average revenue per ticket as useful measures for quantifying demand and working out a break-even price. For each past show, record:
- Capacity and the tickets released at each stage
- Announcement date, presale date, general on-sale date and show date
- Daily tickets sold and daily revenue, by price tier
- Venue, city, day of week, genre and support acts
- Marketing spend by week, if you have it
Our guide to what data you need for an AI concert ticket-sales forecast goes through this list in more detail.
2. Intent signals before on-sale
Signs of interest that appear before a ticket is sold are valuable because they arrive while you can still act. Common ones are:
- Presale registrations and waitlist sign-ups
- Email list growth and click-through on the announcement
- Followers and saves on the artist’s streaming and social pages in your target city
- Search interest for the artist in the weeks before the announcement
- Tracker sign-ups on gig-listing services
Your own email list is the signal you control. If you are building one for a first show, this walkthrough on email marketing for musicians shows how an artist can reach fans without paid ads.
3. Context
Note anything outside your control that could move sales: a competing show in the same city that week, school holidays, a bank holiday weekend, a festival announcement, travel strikes. Give each past show a simple tag so the model, or you, can compare like with like.
4. Secondary-market signals
Resale listing volumes and prices can hint at unmet demand. They are harder to obtain, they vary by market, and they are a supplement. Do not build a first forecast on them.
A workflow you can follow

Step 1: Define the question
Choose one decision the forecast will inform. For example: “Do we release the second tier at the planned date?” or “Do we sign the venue deposit?” A forecast built for a decision stays focused. A forecast built to “see what happens” tends to be ignored.
Step 2: Clean the history
Remove or flag shows with unusual conditions: cancelled dates, shows moved venue, shows with large complimentary blocks. Make sure each show’s sales are counted the same way, either gross of fees or net, and with or without VAT. Mixed definitions are the most common reason a forecast looks wrong. For the VAT side, see our guide to VAT on ticket sales.
Step 3: Build the baseline
Find two or three comparable shows. For each one, work out the share of final sales reached at day 3, day 7, day 14 and so on. Apply those shares to your current show. You now have a first range.
Step 4: Add the early-sales read
The first days of a general on-sale carry the most information, because they show how many committed fans there were. Our article on using the first 72 hours of sales covers what to look at, and the guide to forecasting after the first week covers the next stage.
Step 5: Run scenarios
Turn the forecast into three cases: low, middle and high. Each gets its own ticket count, average price and marketing cost. This is where the forecast meets the budget.
Step 6: Update weekly
Re-run the forecast on a fixed day each week. Compare actual sales with the previous forecast. If you are consistently above or below, find out why before trusting the next number.
A worked example (hypothetical)
The numbers below are invented to show the method. They are not Lookport results and not a benchmark.
A promoter plans a 1,200-capacity show.
- Ticket price: £25, ex VAT
- Fixed costs (artist fee, venue hire, production, marketing): £14,000
- Variable cost per ticket (for example, PRS-related and bar-free costs, per-head production): £1.50
- Ticketing commission at 6% of £25: £1.50 per ticket
Contribution per ticket is £25 minus £1.50 minus £1.50, which is £22.
Break-even is £14,000 divided by £22, which is 637 tickets (636.4 rounded up). That is about 53% of capacity.
The promoter’s comparable show reached 20% of its final sales in week one. This show has sold 240 tickets (20% of capacity) in week one, and the comparable show finished at 85% of capacity. The comparison suggests about 1,020 tickets, but with only one comparison the promoter treats it as a middle case and builds a range:
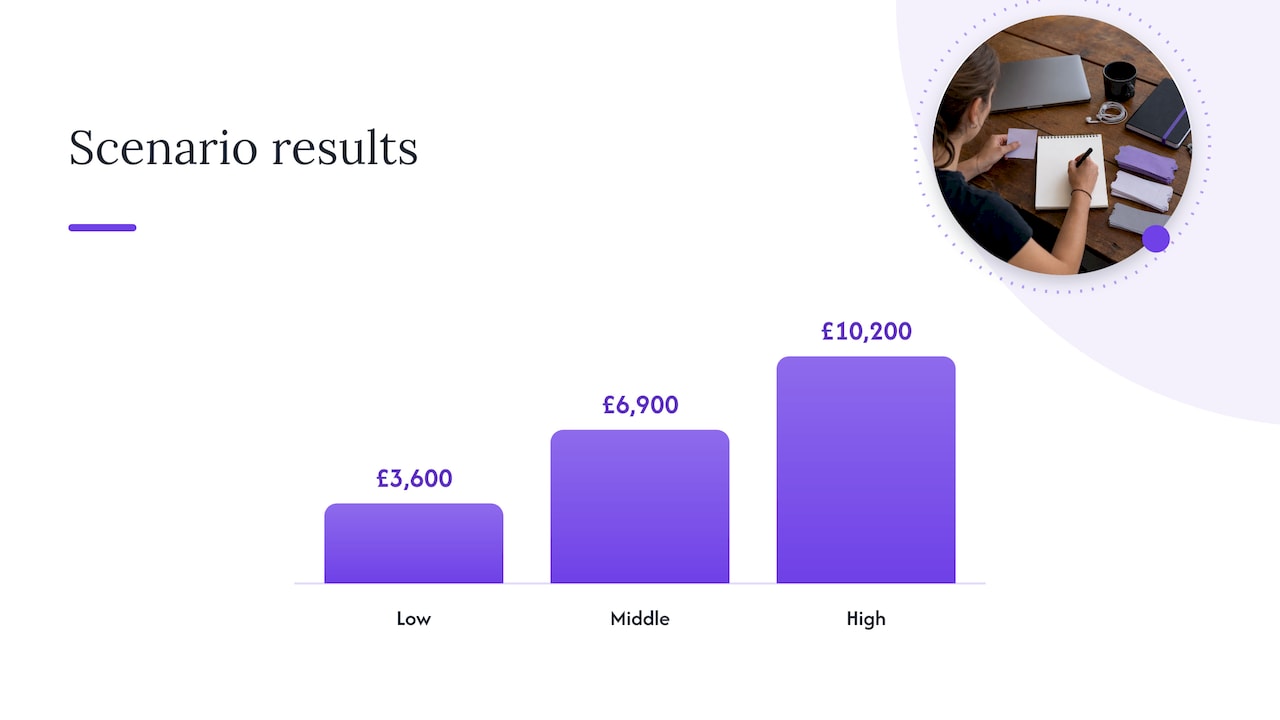
| Scenario | Tickets sold | Revenue contribution (£22 each) | Result after £14,000 fixed costs |
|---|---|---|---|
| Low | 800 | £17,600 | £3,600 |
| Middle | 950 | £20,900 | £6,900 |
| High | 1,100 | £24,200 | £10,200 |
Even the low case clears break-even in this example, so the promoter can proceed and watch week-two pace. If the low case had fallen below 637 tickets, the next move would be to look at price, cost or the date, not to hope.
You can rebuild this with your own costs in the tour break-even calculator. For a fuller picture of the cost side, see the concert budget breakdown and the guide to ticket sales break-even analysis.
How to check whether a forecast is any good
An AI forecast can look convincing and still be wrong. Validate it before you rely on it.
- Back-test. Hide the final results of three or four past shows, forecast them from their first week of sales, then compare. If the model could not call shows you already know, do not use it on a new one.
- Measure the miss. Track the gap between the forecast and the result as a percentage of capacity. A consistent miss in one direction is a bias you can correct.
- Look at the range. If the low and high cases are so far apart that no decision changes, the forecast is not helping yet. Add data or narrow the question.
- Ask what changed. Sudden jumps should have a cause: a press mention, a second date, a rival on-sale. If you cannot name one, check the data for errors.
- Keep a log. Write down each forecast and what you did. After a season you will know how far to trust it.
Limits you should plan around
- Small history. With few past shows, any model has little to learn from. Use ranges and keep the method simple.
- New artists and first-time events. Without comparable shows, intent signals matter more than past sales, and uncertainty is wider.
- Shocks. Illness, weather, travel disruption and rival announcements can shift sales in ways no model sees coming.
- Fixed capacity. The forecast can say you would sell more than capacity. That is a signal to consider a second date or a price change, not a sales number.
- Changing the thing you measure. Running a discount or a big campaign changes the sales curve. Note it in the history so the next forecast does not mistake it for natural demand.
Using audience data lawfully in the UK
Forecasting often draws on customer data such as email addresses, postcodes and purchase history. In the UK, the UK GDPR governs that data. The ICO sets out seven data protection principles, including purpose limitation, data minimisation and security. In practice that means collect only what the forecast needs, say what you use it for and store it securely.
If you want to use the same data to email fans, the Privacy and Electronic Communications Regulations apply as well. The ICO explains that you must not send marketing emails or texts to individuals without consent, with a limited exception for your own previous customers who were offered a simple way to opt out. If you are unsure whether your list qualifies, check the ICO guidance or take advice from a data protection professional before you send.
From forecast to budget decisions
A forecast is useful when it changes a decision. Four common ones:
- Deposits and commitments. Tie larger commitments to the low case. If the low case breaks even, you carry less risk.
- Marketing spend. If sales pace is ahead of the middle case, you may hold budget. If it is behind, you know early enough to act.
- Pricing. If demand looks strong, a later price tier or a dynamic pricing approach may be worth testing. If it looks soft, review the entry price before cutting everything.
- Capacity and dates. A forecast above capacity is the case for a second show.
Our article on AI ticket forecasts for budget cases before deposits shows how to lay these cases out, and the guide to running a sales pacing forecast covers weekly tracking.
Where Lookport fits
Lookport Ticketing is built for concert promoters, event organisers and venues. The commission is 6% with no other Lookport charges, and ticket proceeds go directly into your own Stripe account. Availability follows Stripe-supported countries. You can read the details on the pricing page and model the fee on your own show with the ticketing fee calculator.
Lookport’s ticketing also includes sales and demand forecasting tools, marketing insights and campaign tools, as described on the Ticketing page. Check that page for the current feature list. The forecasting methods in this article are general ones, and you can apply them in a spreadsheet whichever ticketing system you use.
FAQ
How accurate is AI ticket sales forecasting?
It depends on the quality and amount of your history, how similar your past shows are to the new one and how stable conditions are. Be wary of any single accuracy figure quoted without its method. Back-test on your own past shows to find out how accurate it is for you.
How early can I forecast ticket sales?
You can build a rough range before on-sale from intent signals and comparable shows. The forecast becomes more reliable once real sales arrive. The first days of a general on-sale are usually the most informative, so re-run the forecast then and again each week.
Do I need AI, or is a spreadsheet enough?
For a small number of shows, a spreadsheet using two or three comparable shows is often enough. AI helps when you have many shows and on-sale days of data, several signals to combine and a regular need to update forecasts.
What should I do if the forecast is below break-even?
Check the data first, then test the levers: ticket price, costs, marketing, date and venue size. Run each change as a scenario in the break-even calculator before you commit more spend.
Next step
Put your own numbers in the Concert Profit & Tour Budget Calculator to see break-even and profit under low, middle and high sales. When you are ready to sell tickets, see Lookport Ticketing.
Sources
- Practical Strategies for Data and Ticketing, Baker Richards
- A guide to the data protection principles, ICO
- Electronic mail marketing, ICO
Recommended
Ticketing & event budgeting
 2026-11-04
Accessible Tickets Policy for UK Events: What to Include
How to write an accessible tickets policy for UK shows: legal duties, companion tickets, pricing, evidence checks and booking information, with sources.
 2026-11-03
Abandoned Cart Recovery for Events: A UK Promoter's Guide
How UK promoters can cut ticket checkout drop-off and win back buyers: fixing fees, timing reminders, staying within PECR and measuring recovered revenue.
 2026-11-01
Pricing by Venue Size: How to Set Ticket Prices for Any Capacity
Set ticket prices by venue size: break-even price per capacity, tier splits, a price floor and UK all-in pricing rules, with worked examples in pounds.
 2026-10-31
Group Ticket Strategy: Offers and Waitlists That Fill Seats
How UK promoters can design group ticket offers and run an event waitlist that fills seats without cutting full-price sales, with worked numbers and legal checks.
 2026-10-29
Stripe Payouts in the UK: Timing, Instant Payouts and Cash Flow for Promoters
How Stripe payouts work for UK event organisers: first payout wait, schedules, Instant Payout fees and limits, and how to plan show cash flow around them.
 2026-10-29
Post-Event Marketing for Promoters: A 30-Day Plan
A practical post-event marketing plan for UK concert promoters: what to send in the first 48 hours, which KPIs to track and how to link follow-up to sales.