LOOKPORT / TICKETING & EVENT BUDGETING
Marketing Budget Allocation for Concerts: A UK Promoter's Guide
Set a concert marketing budget from gross potential and ticket margin, split it by sales phase and channel, and know when to move money. UK worked example.

Allocate a concert marketing budget in three steps. Start from the show’s gross ticket potential. Cap the spend at what each extra ticket contributes after commission and variable costs. Then divide the money by sales phase and channel, so you can move it as sales data comes in. A flat percentage gives you a starting figure. Ticket margin tells you whether that figure is safe.
This guide is for UK promoters, venues and festival organisers. It uses a hypothetical 800-capacity show so you can follow the arithmetic. Every figure in the worked example is an illustration. Replace it with your own deal terms.
TL;DR
- Set a first marketing figure as a percentage of gross ticket potential (capacity multiplied by average ticket price), then test it against ticket margin.
- Your hard ceiling is the number of tickets you still need to sell multiplied by the contribution per ticket. Spend only part of that ceiling.
- Split the budget by sales phase first and by channel second. Most tickets sell late, but the early weeks set the pace.
- Review spend weekly against sell-through. Move money to channels that sell tickets at an acceptable cost, and stop spend that does not.
- Model the whole show in the tour break-even calculator before you commit any marketing money.
Table of Contents
- Start from gross potential, not from a hunch
- A worked example: an 800-capacity show
- Do not confuse show profit with marketing return
- Split the budget by sales phase
- Split each phase by channel
- Track whether spend is selling tickets
- When to increase, move or stop spend
- What a good return looks like
- Common budgeting mistakes
- Put your budget into Lookport Ticketing
- FAQ
- Sources
Start from gross potential, not from a hunch
Gross potential is what the show earns if every sellable ticket sells at its price. For a single-price show it is capacity multiplied by ticket price. A UK promoter’s example makes the point with small numbers: 200 tickets at £10 gives £2,000 of gross potential, and the show costs come out of that figure.
For a show with several price tiers, add each tier separately, then take off holds and complimentary tickets. Gross potential after comps is the base every percentage in this guide applies to.
Why use this base and not a share of the show budget? Talent and production costs can be several times the marketing line. A budget built as a share of costs ends up tied to the artist fee, not to the audience you need to reach. Gross potential scales with the number of seats to fill, which is the problem marketing actually solves.
A starting percentage to test
A common planning range is 10% to 20% of gross potential. Plan nearer the low end for a venue with a regular programme and a mailing list that already buys. Plan nearer the high end for a new venue, a first-time promoter, a new artist market or a one-off event with no existing audience. Treat these as assumptions to test, not as rules. Your own past shows are a better guide than any published range.
Tour dates behave differently from club nights. A touring act with a known fan base often needs a lower share of gross, because the artist’s own channels do part of the work. A weekly club night or an unproven local show usually needs a higher share. If you have run a similar show before, start from its actual marketing cost as a share of gross.
A worked example: an 800-capacity show
This example is hypothetical. It shows the method, not a result you should expect.
| Input | Value |
|---|---|
| Capacity | 800 |
| Average ticket price | £25 |
| Gross potential | £20,000 |
| First-pass marketing budget at 12% | £2,400 |
The percentage gives you £2,400. Now test it against what each ticket earns.
Step 1: work out contribution per ticket
Contribution per ticket is the average price minus the costs that rise with every extra ticket sold. For this example:
- Average ticket price: £25.00
- Lookport commission at 6%: £1.50
- Other variable costs per ticket (assumed, for example payment processing on your Stripe account and any per-ticket rights cost): £1.00
- Contribution per ticket: £22.50
Fixed costs such as the artist guarantee, venue hire and production are not in this figure. They are paid whether you sell 300 tickets or 800. Once you have covered them, each further ticket adds close to its full contribution to profit. Before that point, each ticket helps you reach break-even.
Check which costs in your own deal vary with sales. A percentage deal for the artist, a door split or a rights fee based on box office all reduce contribution per ticket. Our guide to UK concert budget lines, PRS and break-even shows where these sit in the budget.
Step 2: count the tickets marketing has to find
Not every ticket needs paid promotion. Some fans buy because of the artist, the venue’s mailing list or word of mouth. Estimate that natural demand from comparable shows, then set a sell-through target.
- Natural sales without paid promotion (assumed): 50% of 800 = 400 tickets
- Sell-through target: 85% of 800 = 680 tickets
- Tickets marketing has to find: 280
Step 3: set the ceiling and a spend limit
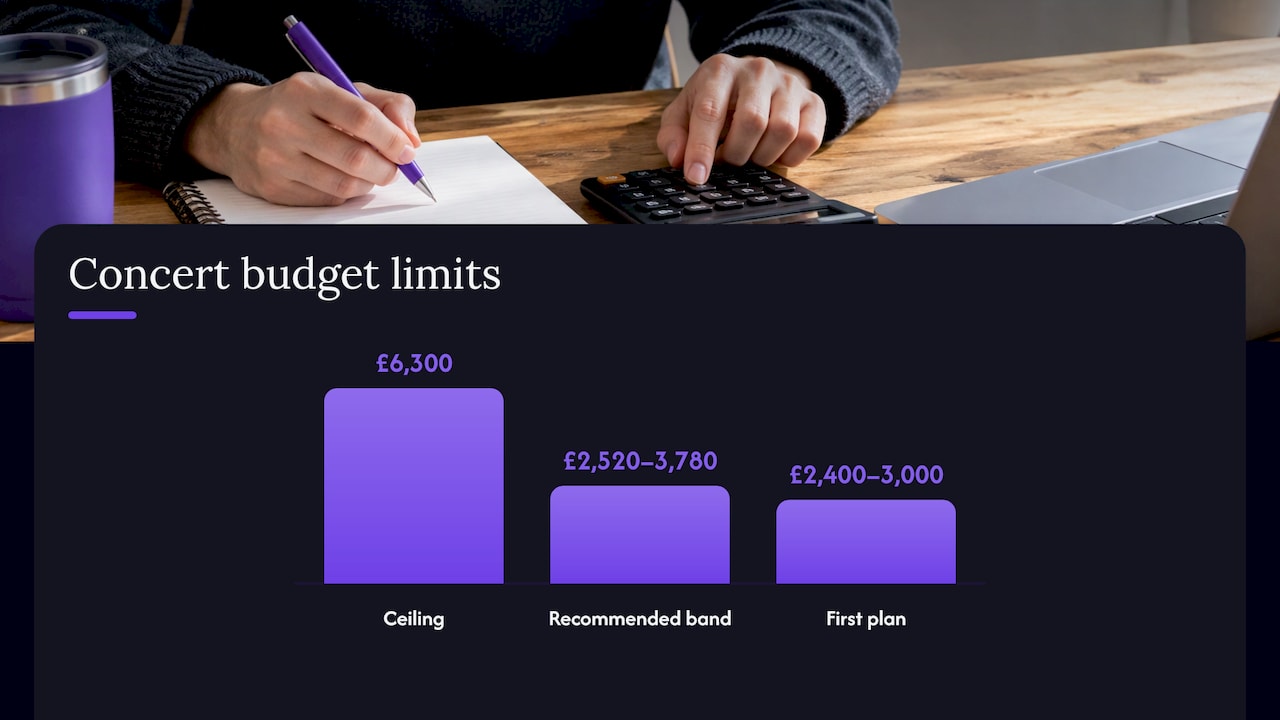
The ceiling is the tickets to find multiplied by contribution: 280 × £22.50 = £6,300. That is the most you could spend before the extra tickets stop adding anything. Never plan to spend it all. Spending the entire ceiling leaves no margin for the tickets it buys, and your estimate of natural demand may be wrong.
A practical rule is to plan to spend roughly 40% to 60% of the ceiling. Here that is £2,520 to £3,780. The 12% figure of £2,400 sits just below that range, so the two methods roughly agree and £2,400 to £3,000 is a reasonable first plan. If the percentage method had given you £5,500, the margin test would tell you to cut it.
In this example, £2,500 spent to find 280 tickets means about £8.93 per ticket found, against £22.50 of contribution. If paid promotion in practice costs £15 per extra ticket, you are still positive but have far less room for error. Our guide to setting concert ad budgets around ticket margin walks through this calculation, including why you must count tickets and orders separately.
Step 4: check the break-even return on ad spend
Return on ad spend (ROAS) is ticket revenue attributed to ads divided by ad spend. The break-even ROAS for an extra ticket is its price divided by its contribution. In this example that is £25 ÷ £22.50, about 1.11. Any ad campaign returning less than £1.11 of ticket revenue per £1 spent loses money on the marginal ticket.
That is a floor, not a target. Your campaign also has to cover creative, design and tools, so aim well above it. Keep revenue and margin on the same basis, either both gross or both net of commission, or the comparison will mislead you.
Do not confuse show profit with marketing return
A campaign can report a strong return on ads and the show can still lose money. The two measures answer different questions. Marketing return asks whether the marketing earned more than it cost. Show result asks whether total net revenue covered every cost, including the artist, venue and production.
Run both. After the marketing test above, put the full show in the concert profit and tour budget calculator: costs, ticket prices, revenue and the break-even number of tickets. Marketing then sits as one line against the whole show, which is where it belongs. A good marketing return on a show that cannot break even is not a good result.
Model at least three outcomes: expected sales, a weaker outcome such as 75% of expected sales, and a sell-out. If the weaker case loses more than you can absorb, reduce fixed costs, raise prices or reduce capacity before you add marketing money. Our guide on choosing venue capacity when demand is uncertain covers the capacity option.
Split the budget by sales phase
Ticket sales are not spread evenly. They tend to come in a burst at on-sale, a slower middle and a rush near the show. Our concert sales curve guide shows how UK tickets typically sell and how to plan around it. Allocate the budget to the phases, then to channels inside each phase.
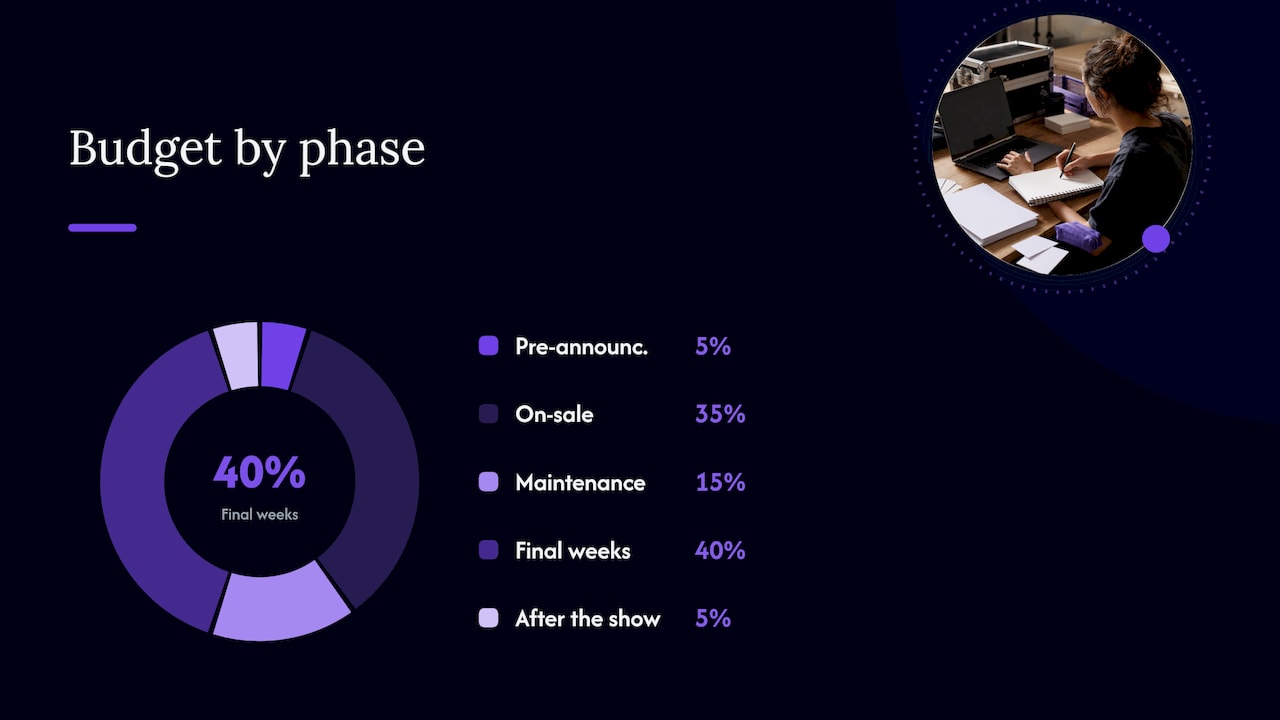
A simple illustrative split of the £2,500 plan:
| Phase | Share | Amount | Job |
|---|---|---|---|
| Pre-announcement | 5% | £125 | Build the mailing list and followers |
| On-sale | 35% | £875 | Reach existing fans and drive early sales |
| Maintenance | 15% | £375 | Keep content moving, retarget visitors |
| Final weeks | 40% | £1,000 | Deadline messaging, retargeting, proven channels |
| After the show | 5% | £125 | Collect contacts and feedback for the next date |
These shares are a starting point. A hot show that sells quickly needs less in the final weeks. A slow one needs more, but only if the earlier data shows that paid promotion sells tickets at a cost you can afford.
The early weeks matter beyond their share of money. The first days of an on-sale show you how demand responds to the price. Our guide to using presale velocity to set prices in the first 48 hours explains how to read that signal before you spend the bulk of your budget.
Avoid saving the whole budget for the end. Late spend works best on people who already know the show. If nobody has heard of it, late ads have no audience to convert.
Split each phase by channel
Channel mix depends on the type of event. A weekly club night, a regional tour date and a resident venue do not reach audiences in the same way.
| Event type | Channels to weight first |
|---|---|
| Club night | Messaging groups, student and community contacts, Instagram Stories |
| Artist tour date | Meta ads geo-targeted around the venue, streaming-platform audiences, the artist’s channels |
| Resident venue | Email to past buyers, Google Search and Maps listing, local press |
| Festival | Line-up announcements, multi-wave paid social, email |
Email to an existing list is usually the cheapest route to a ticket, because the audience has already bought from you. Paid social is better for reaching people who do not know the show. Search matters when people are already looking for the venue or artist. Spread the budget across these roles, not across every platform at once.
For tour dates where the artist’s audience lives on streaming platforms, it helps to understand how promotion budget allocation for independent musicians splits money across channels, then adapt the idea to a city-level date. Paid social needs tracking set up before you start. Our guides to Facebook ads for concerts and Meta Pixel events cover what to check first.
Small shows need small budgets
A small show does not need a large plan. A UK grassroots promotion plan for gigs budgets a total of £20 to £100, mostly posters, flyers and a small social boost, and its worked example shows how an 100-capacity room with £800 of costs can still fall £245 short at mixed ticket prices. The lesson is that at small scale the ticket price and the break-even number matter more than the ad budget.
Track whether spend is selling tickets
A budget only works if you can see what it sold. Set up tracking before the first pound goes out.
- Cost per ticket sold: total marketing spend divided by tickets sold through trackable channels. Compare it with contribution per ticket.
- Sell-through against plan: tickets sold as a share of capacity, checked weekly against your curve.
- Orders and tickets: one order can contain several tickets. Count both, and base cost per ticket on tickets.
- Channel source: which campaign or link led to each sale.
Attribution is rarely perfect. Some buyers see an ad, then search for the show, then buy by email. Use the same rules on every show so that comparisons between shows stay fair. Our guides to concert marketing attribution and ticketing analytics for UK promoters explain what to record and how to match campaign reports to ticket sales.
Validate before you trust a number
Before you move money on a figure, check it:
- Compare the ad platform’s reported purchases with the ticket orders in your ticketing system for the same dates.
- Check that refunds, comps and cancelled orders are removed.
- Check that tickets and orders are not mixed in the same calculation.
- Look at a full week of data, not a single day, unless spend is large.
When to increase, move or stop spend
Set thresholds before launch so that decisions in the middle of a campaign are not emotional.
- Increase spend on a channel when its cost per ticket is well below your contribution per ticket and sales are behind plan.
- Move spend when one channel sells tickets at a clearly lower cost than another. Shift money in steps and watch the result.
- Stop spend when cost per extra ticket exceeds what the ticket contributes, or when a campaign has run long enough to judge and has not sold tickets.
- Hold spend when sales are ahead of plan. More money on a show that is already selling out adds cost, not profit.
A useful decision rule, used in one published event ROI method, is to cut spend on a date when its cost per incremental ticket stays above half the contribution per ticket for a week. Pick your own threshold and write it down.
Use sell-through checkpoints to judge pace. The UK grassroots plan cited above suggests around 20% to 30% sold four weeks out and 60% to 70% sold 48 hours out. Those are guides for small rooms. Build your own checkpoints from your previous shows.
What a good return looks like
Benchmarks from other sectors can still help you set an expectation. UK orchestras measured by the Advisory Board for the Arts took about £3.00 of box office income per £1 of marketing in 2024/25, up from about £2.54 in 2022/23, while marketing budgets stayed relatively flat. Classical programmes differ from pop and rock shows, so use this as a sense of scale, not a target. Your own past shows are the benchmark that matters.
Common budgeting mistakes
- Using revenue after the show to justify the budget. Marketing money goes out before ticket revenue arrives. Check your cash position for the weeks between announcing and the on-sale ramping up.
- Ignoring commission and variable costs. A £25 ticket is not £25 of contribution.
- Setting the budget once and leaving it. Review weekly.
- Spreading money across too many channels. Small budgets need a few channels done properly.
- Discounting too early. Heavy discounts early on can teach buyers to wait. Use pricing tiers with clear deadlines instead.
- Pricing wrongly for the room. Our guide on pricing by venue size helps you set prices that your marketing can sell.
Put your budget into Lookport Ticketing
A marketing plan rests on knowing what you keep from each ticket. With Lookport Ticketing you pay a 6% commission with no other Lookport charges, and ticket proceeds are paid directly into your own Stripe account. That makes the contribution calculation above simple: price minus 6%, minus your own variable costs. Availability follows Stripe-supported countries. See the Lookport ticketing page for the features currently offered, or the commission details.
Before you open sales, model the show with the tour break-even calculator. Enter costs, ticket prices and capacity, and see the break-even number of tickets alongside your marketing line.
FAQ
What percentage of ticket revenue should a promoter spend on marketing?
A common planning range is 10% to 20% of gross ticket potential, with a lower share for established venues with loyal audiences and a higher one for new or one-off events. Treat the percentage as a first estimate. Then test it against contribution per ticket, so you never spend more than the extra tickets can earn.
How do I know my maximum safe advertising spend?
Multiply the tickets you still need to sell by the contribution per ticket. That is your ceiling. Plan to spend only part of it, around 40% to 60%, so the tickets you find still leave margin.
Should I spend most of the budget before or after tickets go on sale?
Split it by phase. Put a meaningful share into the announcement and on-sale period to build early sales, and keep a large share for the final weeks, when many buyers decide. Adjust once you see how early sales compare with your plan.
How often should I review concert marketing spend?
Weekly at least, and daily during on-sale and the final fortnight if you run paid campaigns. Compare cost per ticket sold and sell-through with your plan, and move money only when a full week of data supports it.
Sources
- An example of a contract for a concert, Live Music Business
- How to Promote a Gig or Music Event: 8-Week UK Plan
- The State of Classical Box Office Income and Marketing Spend, UK orchestras, Advisory Board for the Arts
Recommended
Ticketing & event budgeting
 2026-11-22
Multi-Currency Ticketing: A UK Promoter's Guide to Fees and FX
How multi-currency ticketing works for UK promoters: settlement currencies, card and conversion fees, refunds, and a worked example to budget it before you sell.
 2026-11-21
Tour Announcement Strategy: A UK Promoter's Plan
Plan a tour announcement from break-even to on-sale: lead times, sequence, channels, first-48-hour measures and budget, with a worked UK example.
 2026-11-20
Last-Minute Ticket Sales Tactics for UK Promoters
A practical plan for the final weeks before a show: diagnose slow sales, work out your break-even gap, target the right audiences and stay within UK pricing rules.
 2026-11-19
Secondary Market Monitoring for UK Promoters
What secondary market monitoring means for UK promoters: which resale signals to watch, what they tell you about demand, and how to act on them within the rules.
 2026-11-17
Ticket On-Sale Timeline: A Planning Schedule for UK Promoters
Plan your ticket on-sale timeline: announcement, presale, general sale and final push, with a week-by-week schedule and a worked example for UK promoters.
 2026-11-16
AI for Event Marketing: A UK Promoter's Practical Guide
How UK promoters can use AI for event marketing: audience segments, demand forecasts, copy, chatbots and measurement, with ICO rules and a worked budget example.