LOOKPORT / TICKETING & EVENT BUDGETING
Concert Sales Curve: How UK Tickets Sell and How to Plan for It
Learn what a concert sales curve shows, how UK tickets typically sell from on-sale to show day, and how to check your pace against break-even.
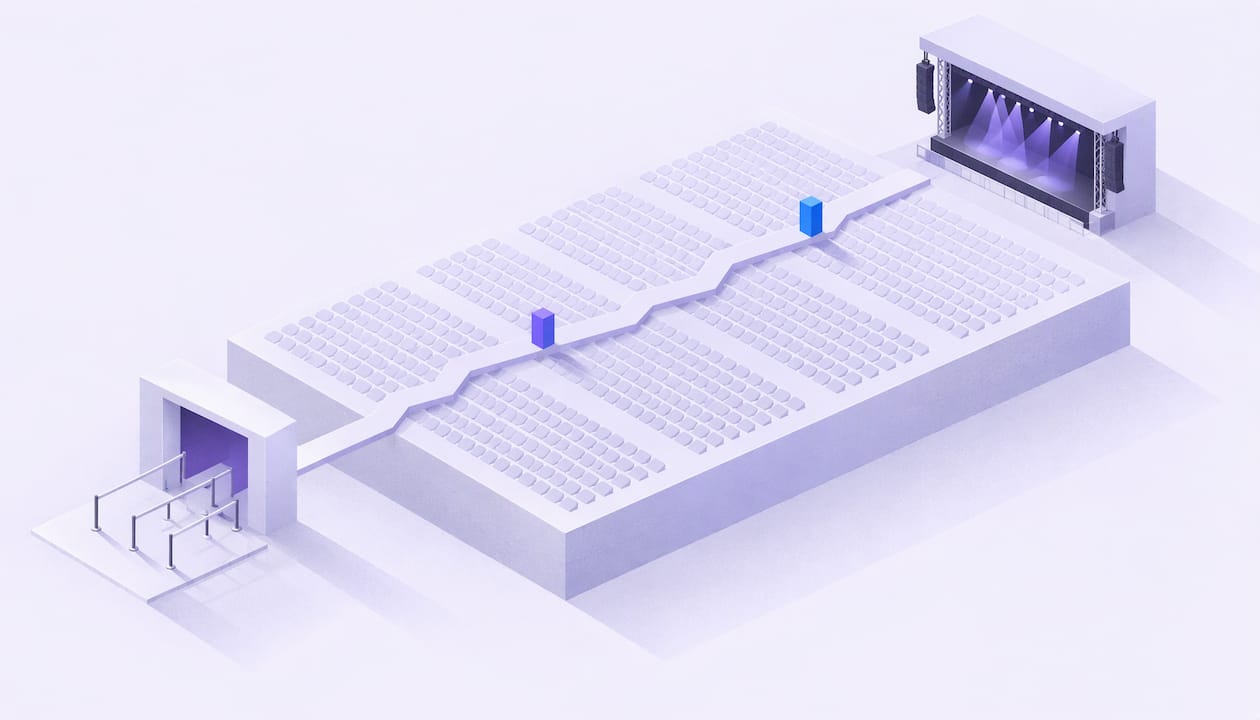
A concert sales curve is a chart of how your tickets sell between the on-sale date and show day. Most curves share one shape: a spike at on-sale, a long quiet middle and a lift in the final week. The useful question is not whether your curve looks normal. It is whether your curve reaches the number of tickets the show needs to break even. You can answer that by modelling costs, ticket price and fees in our concert profit and tour budget calculator, then tracking your sales against that target.
TL;DR
- A sales curve plots daily sales and cumulative sell-through against days to show. Read it against your break-even number, not against an industry average.
- The common shape is front-load, quiet middle, final-week lift. LiveIndex’s illustrative series puts about a fifth of sales in the last seven days.
- No public benchmark curve exists for concerts, because daily sales data is commercially sensitive. Your own past shows are your best reference.
- Many shows do not sell out, so work out the sell-through percentage at which you cover costs before you announce.
- Set pacing checkpoints in advance and decide what you will do at each one if you are behind.
Table of Contents
- What a concert sales curve shows
- The typical shape: front-load, quiet middle, final lift
- Why the last 10% matters so much
- Build the curve around break-even, not capacity
- Set pacing checkpoints before you announce
- Forecasting without misleading comparisons
- What to do when you are ahead or behind
- Where AI forecasting fits
- Keep the numbers in one place
- FAQ
- Sources
What a concert sales curve shows
There are two lines to read, and they answer different questions.
Sales velocity is the rate at which a show sells. LiveIndex defines it as tickets per day, or per hour early in an on-sale, usually smoothed with a rolling average. It tells you what is happening now: did the on-sale land, is the campaign working, is the last week waking up.
Cumulative sell-through is the running total of tickets sold as a share of sellable capacity. It tells you where you stand against the number the show needs.
Plot both against days to show. Put a horizontal line on the chart at your break-even sell-through. That one line turns a decorative chart into a decision tool, because you can see how much runway is left.
Two terms worth fixing before we go on:
- Sellable inventory is the number of tickets you can actually sell after holds, production kills and comps are removed from capacity. Use it, not headline capacity, as your denominator.
- Break-even sell-through is the share of sellable inventory you must sell to cover every cost of the show.
The typical shape: front-load, quiet middle, final lift
LiveIndex publishes a 60-day series to show how a curve can look. It is synthetic, labelled as such, and not real show data. In it, the biggest single day is the on-sale day, and the first two days account for a little under a third of everything sold. Sales then decay to a trickle through the middle weeks. In the final seven days, including show day, about a fifth of total sales arrive.
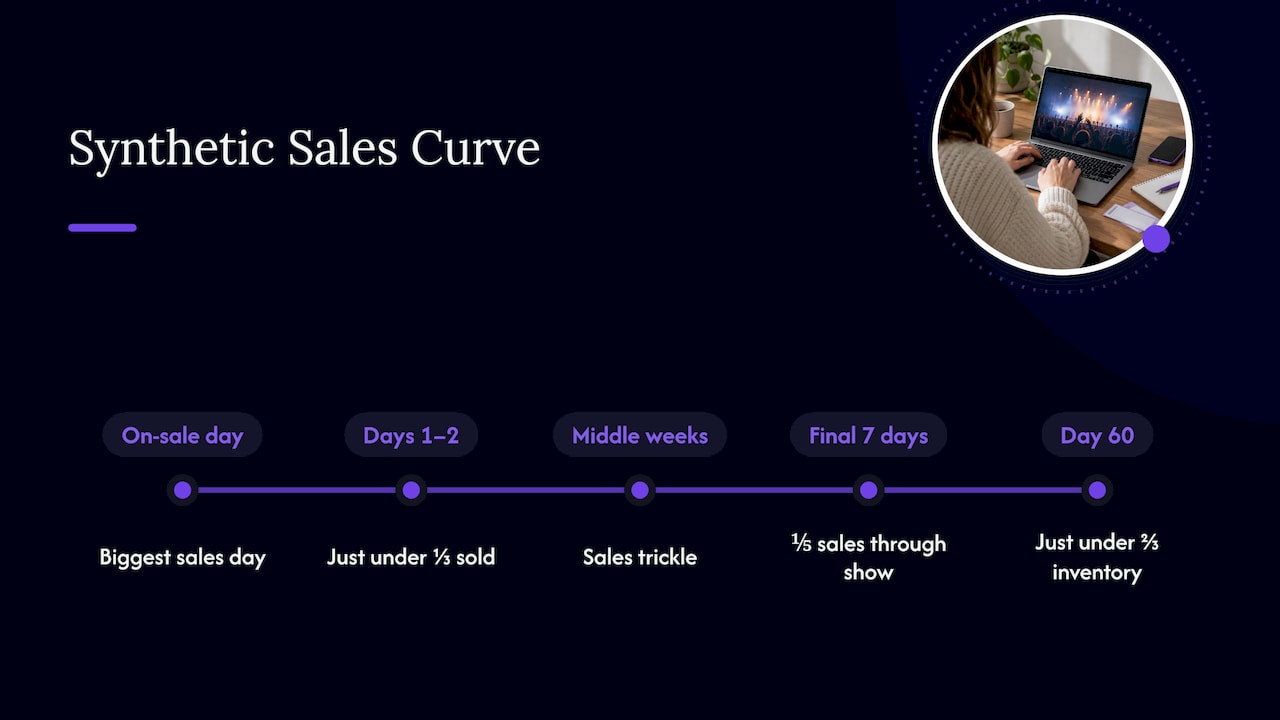
The same illustrative curve ends at just under two-thirds of sellable inventory. LiveIndex’s point is that this shape can exist even when a show does not sell out.
Treat that as a description of a shape, not a target. LiveIndex also states that there is no published normal velocity curve for concerts, since daily ticket-sale data is commercially sensitive and not publicly documented. If someone quotes you a universal percentage for week three, ask where the data came from.
Why buyers leave it late
The direction of travel is consistent across the industry. INTIX, the international ticketing association, reports industry experts describing compressed purchasing windows. Buyers wait until closer to the event, driven by economic caution, easier access to resale and confidence that tickets will stay available.
It also notes a comment from the Tessitura network that audiences may spend more per ticket but attend less often. Using data to stay in touch with patrons during the sales window helps encourage repeat attendance.
For a promoter, the practical reading is simple. A flat middle is not automatically a failure, and a strong on-sale is not automatically safe. Both need to be measured against what the show requires.
Why the last 10% matters so much
The final tickets often decide whether you make money. The Guardian reports the industry saying that profits are made only in the last 10% of ticket sales. The same article quotes Dice’s founder on the risk for small venues. A promoter who fails to sell out a 100-capacity gig can lose around £1,000.
The lesson is about margin, not marketing. If most of your sales cover costs and only the last slice is profit, then a curve that stalls at 60% can be a loss even when the on-sale looked healthy.
Build the curve around break-even, not capacity
A curve only means something once you know the finish line. Work it out in four steps.
- List every cost of the show. Artist fee, venue hire, production, staffing, security, insurance, licensing, marketing and any travel or accommodation. For a run of dates, cost each date separately before you total them.
- Set your ticket price and tiers. Use the average net revenue per ticket across tiers, not the top price. Early-bird and concession tiers pull the average down.
- Deduct fees you bear. If you absorb the booking fee, subtract it from each ticket. With Lookport, the platform charge is a 6% commission with no other Lookport charges, and proceeds go straight to your own Stripe account.
- Divide costs by net revenue per ticket. The result is break-even tickets. Divide by sellable inventory for break-even sell-through.
The Lookport calculator models costs, ticket prices, revenue and break-even in one place, so you can change a price or a cost line and see the target move.
A worked example (hypothetical)
The numbers below are invented to show the method. They are not results from a real show.
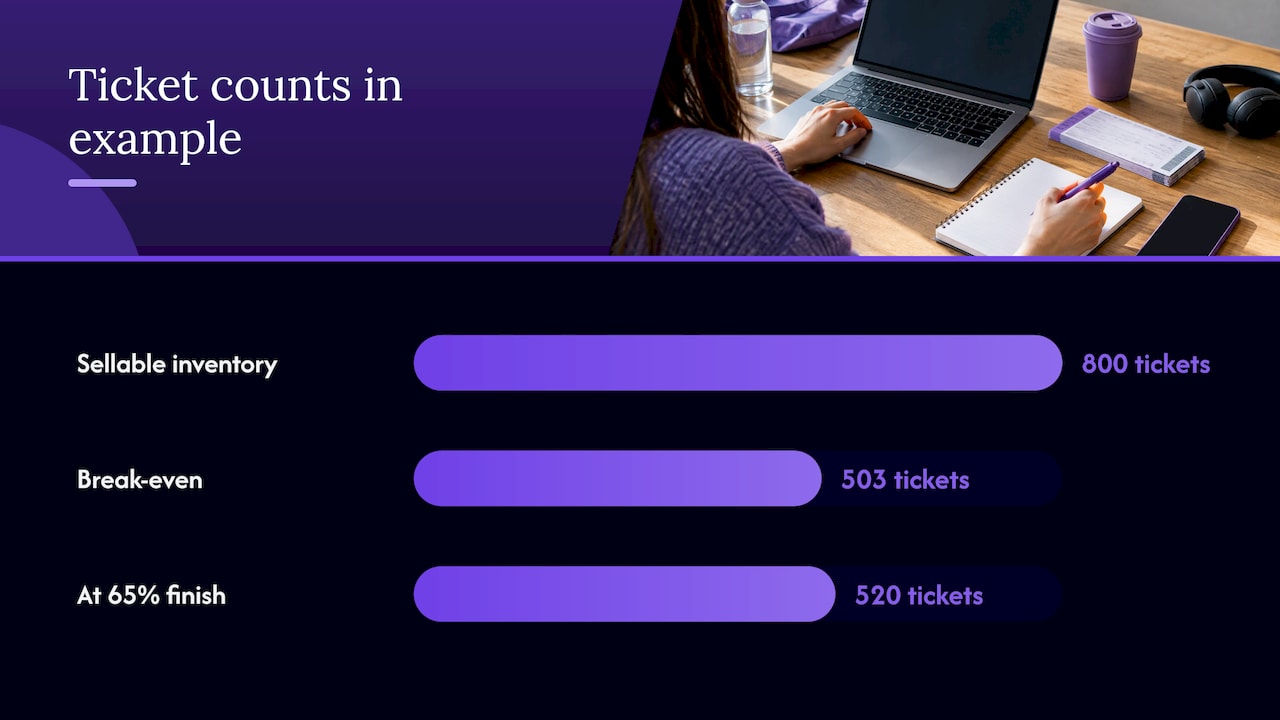
- Venue sellable inventory: 800 tickets
- Single ticket price: £22.00
- Lookport commission at 6%: £1.32 per ticket
- Net revenue per ticket: £20.68
- Total show costs: £10,400
Break-even is £10,400 divided by £20.68, which is 502.9, so 503 tickets. That is 62.9% of 800.
Now compare that with the shape of LiveIndex’s illustrative curve, which finishes just under two-thirds. Suppose your show ends at 65%, or 520 tickets. You clear break-even by 17 tickets, which is a surplus of £353.60. On a curve with that shape and those costs, there is almost no cushion. A single weak final week turns a small profit into a loss.
That is useful to know before you commit to the deposit. It tells you to renegotiate a cost, adjust the price, or plan extra marketing for the final stretch.
Set pacing checkpoints before you announce
Checkpoints turn the curve into a plan. For each one, write down the number of tickets you expect and the action you take if you are short.
Using the hypothetical 503-ticket target and the illustrative shape, a plan might look like this:
| Checkpoint | Illustrative share of final sales | Tickets needed (of 503) | If behind |
|---|---|---|---|
| First two days | A little under a third | Roughly 160 | Review the audience and message. Was the on-sale reaching the people who bought last time? |
| Middle weeks | Slow decay, low steady sales | Small daily numbers | Keep spend low and steady. Avoid panic discounting. |
| Final seven days | About a fifth | Roughly 100 | Raise marketing weight, use reminders, consider group offers. |
The percentages come from LiveIndex’s synthetic series, so treat them as a template for the shape. Replace them with your own history as soon as you have it.
To avoid fooling yourself, LiveIndex suggests asking three questions:
- Did the on-sale confirm the draw estimate you made?
- Does a projection of mid-campaign sales reach the number the show needs?
- Do your interventions show up as step changes in the daily series?
The third question is the one most teams skip. If you ran an ad burst and the daily line did not move, you have learned something about that channel for the next show.
Forecasting without misleading comparisons
Because there is no public normal curve, comparisons are where promoters go wrong. These habits keep you honest.
- Compare like with like. A 300-capacity club night and a 5,000-capacity seated show do not sell alike. Genre, day of week, season and ticket price all change the shape.
- Use your own history first. Pull daily sales from your last five or ten comparable shows and overlay them on one chart. The spread between them is your realistic range.
- Use the same denominator. Compare sell-through of sellable inventory, not raw ticket counts.
- Separate organic from pushed sales. Mark when you sent emails, launched ads or announced support acts.
- Do not assume a tidy curve. Eventcloud, writing about one Asian market, reports that 37% of transactions in May 2026 came within seven days of the show, and 55% for pop concerts. It warns that a forecast built on a tidy curve may be measuring the wrong thing. The market is not the UK, but the warning on forecasting applies anywhere.
After the first week of sales you have enough signal for a first projection. Our guide on forecasting concert ticket sales after the first week walks through that step, and the ticket sales pacing calculator helps you check pace against a target.
What to do when you are ahead or behind
When you are ahead
Being ahead of the curve is a chance to protect margin, not to relax.
- Check whether you are pulling forward sales that would have come anyway. A hot first two days with a dead second week is common.
- Hold your price. If demand is strong, look at releasing a higher tier rather than discounting later.
- Consider whether a second date is justified. Run it through the calculator first, as a separate cost line.
When you are behind
Diagnose before you spend.
- Is the gap at on-sale (the audience estimate was too high) or in the middle (normal quiet period)? These need different responses.
- Re-run break-even. If costs fell or the average price rose, the gap may be smaller than it looks.
- Put extra effort where buyers actually buy. Given the late-buying trend INTIX describes, the final weeks are where reminders, last-chance messaging and group offers have most to work with. Our notes on offers and waitlists for group tickets cover one option.
- Tie spend to margin. The concert ad budget guide shows how to cap what you pay to sell each ticket.
If the ticket price is part of the problem, review it early. The first 48 hours are when presale velocity tells you most, and our piece on using presale velocity to set prices explains how to read it. For UK fee rules, see the ticket fee strategy guide.
Where AI forecasting fits
AI forecasting methods fit a model to past sales, price, marketing activity and calendar effects, then project the remaining days. They need clean daily data, consistent show definitions and enough comparable events to learn from. They can be wrong when a show is unlike anything in your history, when a headline act is added, or when a one-off event shifts demand.
Validate any forecast the same way you would a human estimate: back-test it on shows you already know the outcome of, and see how far off it would have been at the one-week and two-week marks. A forecast is a range with a stated margin of error, not a promise.
Our longer guides cover the method: AI ticket sales forecasting for UK concerts, three budget cases before you pay deposits and running a sales pacing forecast.
Keep the numbers in one place
A sales curve is only as good as the sales data behind it, and the break-even target is only as good as the budget behind it. We built Lookport Ticketing for promoters, organisers and venues who want both in view. It charges a 6% commission with no other Lookport charges, and ticket proceeds are paid directly into your own Stripe account. Availability follows Stripe-supported countries. You can read how it works on the Ticketing page.
If you are choosing a platform, the guide to choosing a ticketing platform sets out the questions to ask. For multi-date runs, see our page on tour management.
FAQ
What is a concert sales curve?
It is a chart of tickets sold over time, from on-sale to show day. It usually combines daily sales with cumulative sell-through as a share of sellable inventory. Add your break-even line and it shows whether you are on track.
When do most concert tickets sell?
In LiveIndex’s illustrative series, sales peak on the on-sale day, fade through the middle and lift in the final week, with about a fifth of sales in the last seven days. INTIX reports buyers increasingly waiting until closer to the event. Your own past shows give the most reliable pattern.
Is there a standard sales curve I can compare against?
No public one exists. LiveIndex states that daily sales data is commercially sensitive and not publicly documented. Compare against your own comparable shows, using sell-through of sellable inventory.
How do I know if I am behind?
Calculate break-even tickets, then set checkpoints for each stage of the on-sale. If projected sales from your current pace fall short of break-even, you are behind. The break-even calculator gives you the target to measure against.
Sources
- Ticket Sales Velocity: How Fast a Concert Is Selling, LiveIndex
- 2026 Ticketing Trends, Part 4: Distribution, Purchase, INTIX
- The gig economy: ticket inflation is getting worse, The Guardian
- 37% of Tickets Now Sell in the Last 7 Days, eventcloud
Recommended
Ticketing & event budgeting
 2026-11-13
Own Your Ticketing Data: A UK Promoter's Guide
What owning your ticketing data means under UK GDPR, which buyer data to keep, and how to set up referral tracking and marketing consent so it works for you.
 2026-11-12
Anti-Bot Ticketing: How UK Promoters Protect an On-Sale
How anti-bot ticketing works, what the UK ban on ticket bots means for promoters, and how to layer defences without blocking genuine fans at your on-sale.
 2026-11-11
GDPR for Event Marketing: A UK Promoter's Guide
How UK GDPR and PECR apply to event marketing: lawful basis, email and SMS consent, ticket-buyer privacy notices, retention and choosing CRM software.
 2026-11-10
Geo-Targeting Concert Ads: A UK Promoter's Guide
How to set up geo-targeted concert ads in the UK: choose radius, split tour dates by city, track ticket sales and stay within PECR consent rules.
 2026-11-09
Drip Pricing Rules in the UK: What Ticket Sellers Must Show
UK drip pricing rules for ticket sellers: which fees go in the headline price, how VAT on booking fees works, fines, and a checklist for promoters.
 2026-11-08
UTM Tracking for Events: A Practical Guide for UK Promoters
Learn how to tag event links with UTM parameters, name campaigns cleanly and read GA4 reports so you can see which marketing actually sells tickets.